Estimating your DollarShadow
J.L. Henshaw
ed. 7/05/07 9/28/10 12/3 1/8/11 1/17/14
08/28/15 08/15/19 8/25 Research notes on
How to Understand the True Scale of your Energy
Use
note: These are real numbers but examples only to
illustrate scale, and to give you ideas of how to do your own
|
Understanding
the total Economic impacts of what we pay for (hist)(sci)
Example
1: The CO2 caused by the
ink, paper & printing for handouts
(Ex 2 vii for math)
[CO2/$GDP = ~ 1lb CO2 or .45 kg
per $1GDP of average end user consumption]
~$36/ream, CO2 impact on the earth =>
~36lb or 16.2 kg CO2
Example 2: Land area of solar
farms to supply energy for US GDP
(Ex 3 for math)
[PV Farms = 2.9 sq mi/$billionGDP, US GDP ~$17 trillion/yr]
implied land
use impact => ~50,000 sq mi
of solar farms today
then.... w/ normal doubling of the area, and so the energy
needed every 35 years
becomes => +
50k, +100k, +200k, +400k... etc.
becoming the total land area of the US (3.806 sq mi) in
~200 years!*
(*if the past pattern of growth
continues) |
|
|
Five True Energy Budget Stories:
Each shows a true calculation of economic energy demands generally ignored...
The "big secret" is hidden environmental services
all around the world are your largest environmental impact. What you
pay business for gets passed on to pay for widely distributed chains of services
as part of what you purchased. It makes you financially responsible,
and moreover directly exposed
to, the not so hidden dangers connected to the economic and environmental
harms the earth now rapidly emerging, that no seems to realize they are paying
for and so responsibility for.
When lacking specific
information, a scientific accounting must treat hidden energy uses as
"average", using the "null hypothesis" that allows the accounting system to
"close".
It turns out the world community has been making the
opposite assumption, only recognizing energy impacts and financial
responsibility for them that people have specific information on, a regular
practice of ignoring what is hidden, and being directly paid for as we use
money. That's not sustainable! The practice has been
to use the wrong "null hypothesis" for lack of specific information,
treating the hidden energy costs of using the economy as "zero". This
has caused all kinds of misunderstanding, treating "sustainability", as
meaning "hiding your impacts".
The world average energy use impact for any
average dollar spent
is the ratio of total purchased energy supply (TPES) to world
total end user product (GDP) (7)(sci):
Energy production and use Impacts: ~8000 btu or ~7.6 jules or 2.4kWh (/$GDP
2006)
CO2 impacts: ~1lb or .46kg
(/$GDP 2006)
(both declining with regularly improving worls
economic efficiency at ~ 1.24%/yr)
that's the
"reality math" needed to account for the large hidden energy
use behind every product and service,
and to make sustainability accounts "close" by reflecting true shares of the
world total
in doing for your Scope 4 Whole
Systems Energy Assessment
for example
- Volume of CO2 per $ GDP :
0.46 kgCO2/$ *
2.1m3/kgCO2 =>
0.97 m3CO2/$ of GDP 2006
so if you make $50,000 a year that's 50,000 cubic meters of
CO2 produced for you as a world average, the volume of ~20 three story
townhouses...
Pollution is often removed by hiding it, with outsourcing or
reducing visible part, quieting the messenger so its silent,
but still deadly.
1. What
Average means: (&
sci notes)
The world average energy use per dollar of
GDP is the amount of purchased energy resourced from around the world to deliver
an average $'s value of goods or services. Because it's so much
larger than the visible energy uses of commerce it is a much more accurate
measure than even very carefully tracing visible energy uses
(f).
To measure individual economic impacts on the earth $1
≈ 1 average share of the world economy, its
total energy use and all its impacts, since every $ needs the services of the
whole economy (i) (ii)... Which turns out to be surprisingly accurate for energy
use
(f)
World
avg. ~= 8000btu/$ GDP (or 2.4kWh/$ GDP) = unit energy demand for average end
user products
(IEA 2006 World TPES/GDP-PPP
and 2006$ )
i) Average values are true for individual cases "on average".. and most products
require such highly divers energy uses to deliver them it's also rare for the
energy required to deliver the $1 of value to be far from average (f).
ii) I finally found people interested and able to study the sources and
equations to confirm these figures from Table 1 below, in a
discussion on Azimuth with John Baez. There was one "small" error
found, now corrected, made in revising the whole calculation for this update of
the old work.
2.
General scales of visible and hidden energy use:
(rough estimates)
| |
|
Energy Use |
CO2 pollution |
| Systems Compared |
Financial Budget |
Units |
Visible Energy in Fuel Use |
Hidden energy in income uses
2.4 kWh/$GDP |
Total Energy Demand |
The error in counting only visible energy |
Units |
Hidden in income uses .45kg/$GDP |
| a Family in town w/car (iii) |
House
& Car
$50,000 |
mWh |
house & car
20 +
16 |
120 |
156 |
433% |
mtonne |
22.5 |
| a Family "off grid" w/car (iv) |
House
& car
$50,000 |
mWh |
house & car
5 +
16 |
120 |
141 |
672% |
mtonne |
22.5 |
| a Family "off grid" walking (v) |
House
$50,000 |
mWh |
House
5 |
120 |
125 |
2500% |
mtonne |
22.5 |
printing paper
200 handouts (vi) |
paper, ink &
printer
$36 |
kWh |
paper
& elec.
10 |
84 |
169 |
1690% |
kg
lb. |
16.2
36 |
The reason for the "hidden energy use" is that each dollar
spend demands energy services around the world to deliver the product, at a
world average rate of 2.4 kWh (or 8000 btu) per $GDP in 2006$. The
rate is slowly declining as world economic efficiency improves as a fairly
regular 1.24% per year.
iii) A modest income family, as US national average, maybe a 2000sf house paying
$2500 for heat and electric and $1800/yr for gas for a car.
iv) The same family, generating its own energy by Wind or PV in theory
might be able to generate their own heat & electric.
v) The same family, walking to work and store, generating their own energy and
just using a taxi now and then.
vi) We print handouts for meetings, hoping the information will have a greater
compensating effect on reducing our energy footprint in the end... but it may
take a while. If I spent on anything else, on average it would have a
similar scale impact in hidden energy costs throughout the economy.
A 200 page ream of paper on a desktop printer
might use up a $25 ink cartridge cost, $.30 electricity and $1 of
wear on the printer, and $10 of paper. The direct energy costs to produce
the paper, 8kWh and to run the printer, 1kWh.
...Probably the
Biggest Surprise...
3. Calculation of PV Land Area
Needed
- using solar radiation availability from map below -
- the 2008 total area of PV to supply energy to the economy turns out to be
~4 time the size of Colorado,
and
- doubling in size every ~35 years to provided for "customary growth"
- and in 200 years a total of 1/4 the landmass of the Earth!
The theory is simple (2019 notes)
Combine values for avg available sunshine (5kwh/m2.dy)
with loss factors: avg. PV eff. (19%), land not covered (50%), and system
operation time (83.3%), to estimate the total solar farm size for supplying the world's
energy needs.
I originally did the calculation with 2008 data, though
the ceiling for PV efficiency moved up 10%, so I might update that. The
rest of the global data is not much different: global energy demand and growth
rate, being the most significant scale factors.... There most
clearly is some mistake!! Can you find it?? What else might I
adjust?? I think perhaps everyone else has used finite planning horizons,
like local payback, and never bothered to do this
calculation.
What do you think the error is??
|
Table 1. |
2008 Units |
|
Solar energy available for PV (a) |
metric
imperial |
|
*avg incoming kW |
5 |
kWh/m^2.land.day |
|
|
|
1825 |
kWh/m^2.land.yr |
x3.15 |
579 |
kbtu/sf.l.yr |
|
High Performance PV |
loss factors |
remaining |
|
|
|
|
** reduce for PV efficiency |
0.19 |
19.0% |
|
|
kbtu/sf.yr |
|
*** reduce for land coverage |
0.50 |
9.5% |
|
|
kbtu/sf.yr |
|
**** reduce for operation pauses |
0.833 |
7.92% |
|
|
kbtu/sf.yr |
|
PV farm Energy Conversion rate |
144.5 |
kWh/m^2.land.yr |
|
45.8 |
kbtu/sf.yr |
|
|
|
|
|
|
|
|
Ave energy/$GDP (
Fig b or Table
3) |
|
|
|
|
|
|
World GDP (PPP) 2008 |
63,865 |
10^9 $GDP |
|
|
|
|
World energy use 2008 |
143.1 |
TkWh |
x3.41 |
419 |
Quad btu's |
|
Long term constant doubling rate |
34 yr |
|
|
34 yr |
|
|
Average energy Intensity/$
|
2.2 |
kWh/$ |
|
6.6 |
kbtu/$ |
|
|
|
|
|
|
|
|
$'s GDP per unit of area |
$64.48 |
$/m^2.yr |
x10.8 |
$0.51 |
$/sf.yr |
|
Area for $1 of avg
GDP energy/yr |
0.155 |
m^2.yr |
|
1.98 |
sf.yr |
|
|
|
|
|
|
|
|
Area for $40k Income |
620.3 |
m^2.land |
10.803 |
6,701 |
sf.land |
|
$1 million Income
|
15,509 |
m^2.land |
|
167,533 |
sf.land |
|
Area for US $17 trillion GDP |
263,646 |
km^2.land |
|
385,734 |
sq mi.land |
|
Area for World $64.4 trillion |
1,291,414 |
km^2.land |
|
498,665 |
sq mi.land |
|
Share of Earth Landmass 196 M sq mi |
.0386 |
of Earth land |
|
.0386 |
of earth land |
|
Years to cover all land, x2 ea 33yr |
~140 |
Years |
|
~140 |
Years |
The question of course, how long can we keep doubling our energy use?
1) Can we even cover whole land masses with solar farms, let
alone the entire earth's in 140 years??
2) The demand for energy doubling every 34 years for a world
economy doubling every 22 years is quite clear
2) After providing 498 sq mi of solar farms for 2008 energy
use could we double that in the next 35 years??
3) There seems no evidence at all of "decoupling"
that would allow economic growth with less.
4) In any case, don't we definitely need to very soon
"flatten the curve" to make life sustainable??
sq ft/sq mi = 27,878,000 | sq ft / m^2 = 10.764 | m^2 /
sq mi = 2,589,900 | k.btu/kWh = 3.41214
|
* Avg Incoming solar energy is
a mid-latitude average, and not likely the world average, and
ignores all other kinds of restrictions such as forbidding terrain
and distance from habitation.
**A nominal peak efficiency of 19% is now achievable
for solar panels. It might be 50% in the future, but at high cost.
*** A rough estimate that solar panels would cover 50% of the land
area in a solar farm
**** The EROI (energy return on energy invested) of 6:1 is a rough
estimate using SEA (d) for the "usual" net
energy produced by high performance PV solar farms in the US
economy. It seem likely to be optimal rather than
average, but would take study. The value would be quite
sensitive to the costs of the land, operations and equipment, as
well as the average radiation from the sun at a particular location.
The value of 6:1 means that 1/6 of the energy gain is lost in the
effort to produce energy. |
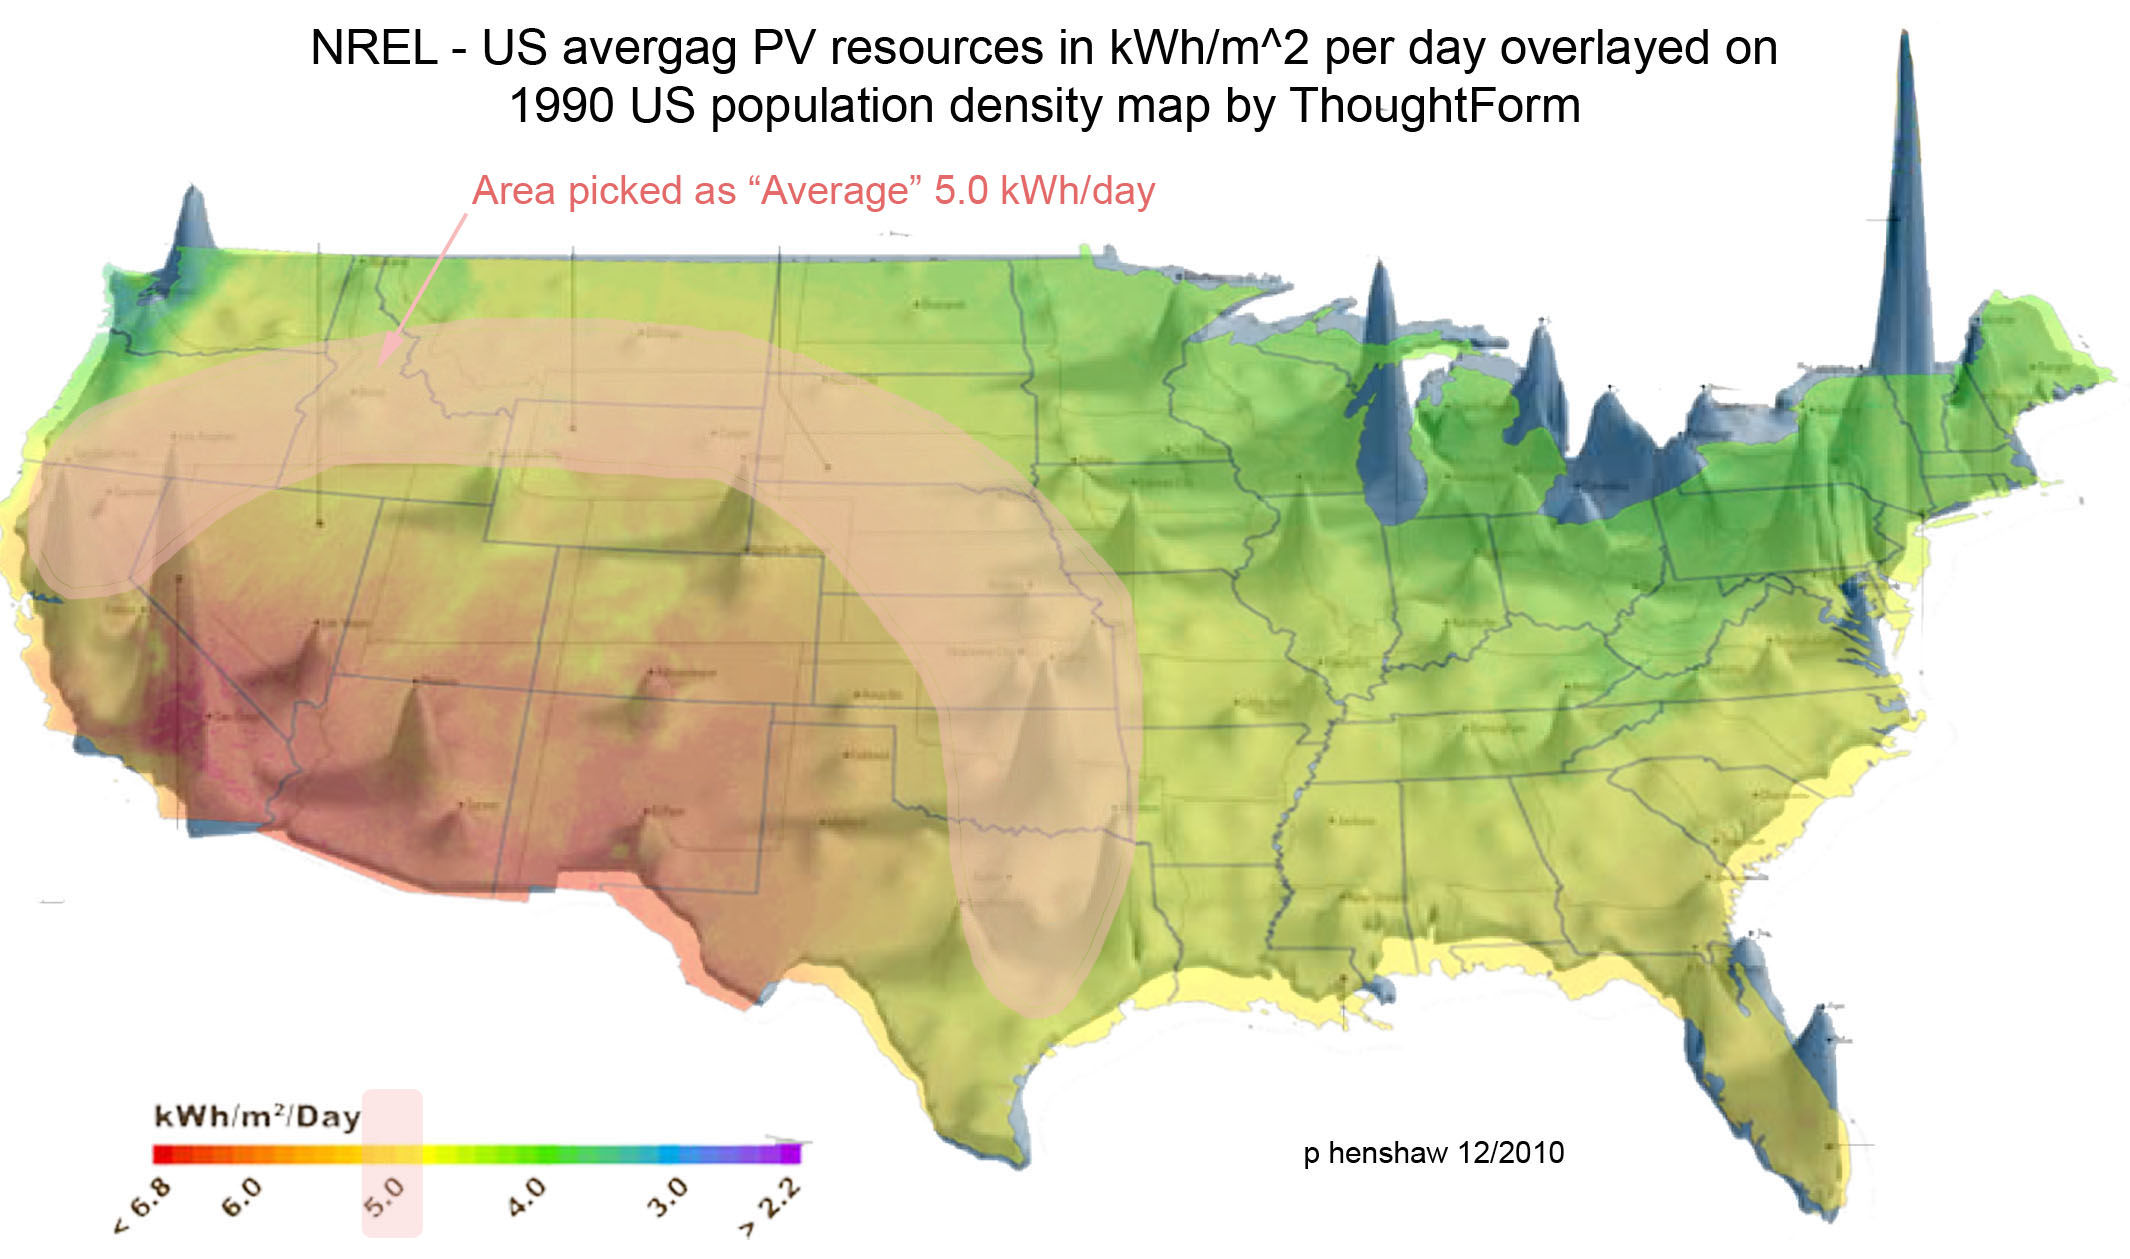
Figure A. Annual average daily solar radiation available in the US
overlaid with 1990 US population density (a, e)
One reason to
think of our impacts on the earth as proportion to the money we earn and spend
is that every dollar is one equal share of the total product of the whole world
economy. All economic impacts are energy impacts, and all the things
that cause economic impacts are purchased. For energy use the "average
energy per dollar" also turns out to be a fairly accurate estimate of the real
total use of energy and production of CO2 pollution, seemingly +/-15% mostly.
What you can be sure of is it will be fairly close most of the time, and will be
a far more truthful measure of the scale of impacts for any purchase
choice than zero.
Why it's fairly
accurate most of the time is because energy is the universal resource, and
traded around the world at a world price, as discussed a bit further below.
The best present research on this method of analysis is a draft paper
Defining a standard
measure of energy use for businesses, using a wind farm and its energy
return on investment (EROI) as an example. By switching from adding
up the receipts businesses collect from purchasing energy, to treating the
prices of things as a receipt for average energy use in all the work that went
into what was purchased, four times the energy uses being employed are found.
The main reason
is ... *because we pay for
them* ...
and the price we pay is an accumulation of all the prices reflecting the work of
all the people and machines along the way that brought the product or service to us.
That's the key. It will change how energy accounting is done
entirely when it is appreciated that economic footprints are far easier and more
accurately measured with money than trying to follow almost untraceable threads
connecting diverse causes and effects, as well as the significance of finding a
500%+/- typical error in our primary measure of sustainability....
9/28/10
4. Suburban
Home Example:
| |
Budget for
an "average" suburban home with a 1500sf footprint and family income
of $80k/yr, |
| |
Energy budget |
|
| step 1 |
Energy/GDP => $1 share ≈ 8000btu/$ (or 2.4kWh/$ )
|
|
| step 2 |
Using Solar Panels to produce a $1 share ≈
.5 sf for a year (table 1).
|
|
| step 3 |
needs
4,000 sf area for PV panels,
|
|
| step 4 |
needing a solar farm ~2.7 times the
home's roof area, and growing with income
to be truly grid neutral
(iv) |
|
iii) Using Charcoal to Fix the price of carbon emissions
http://sspp.proquest.com/archives/vol5iss2/editorial.gray.html assumes no
continuing land use cost to protect the buried carbon
iv) "truly grid neutral" and "truly carbon neutral" are a quick way to say that
the family provides as much energy and carbon sequestration for the economy as
the family's share of the economy as a whole, "on average". So
for the US the energy used to produce our products in China is counted in the US
average consumer budget. "Normal"
economic growth of 3.1% per year would increase the PV area and cost of CO2
sequestration ~1.8% per year, slower than the growth rate due to normal
efficiency improvement.
5. Consumer product Example:
Money spent on a soda or glass of wine, like a receipt for
a
share of world energy and carbon costs.
As a measure of energy use it's quite accurate, on
average, and makes spending or earning a dollar responsible for one equal share
of all the impacts of energy use too. You can appreciate the meaning of "average
share" using it to measure how much CO2 (your carbon footprint) is created with
normal expenses. Try to compare the benefits and the costs with these two
examples. (b Table 1)
So...
a 16oz soda
for $1.50 would put
~24oz of CO2 into the atmosphere,
as average spending from conventional
energy sources, and use the equivalent of
10 oz of oil. To use solar energy it would take the
use of a 100sf of a solar farm for
a day to generate the same energy with PV.
And...
a 6oz glass of wine
costing
$6 would produce ~96oz (6lb) of CO2,
16 times the weight of the drink
as average spending for
conventional energy sources, using the energy of 39 oz of oil, or...
require the use of a 384sf of a solar farm for the
day to get the same energy from PV
6. Global footprint Example:
The global "dollar shadow" for
using PV to supply the present world energy demand, estimated in %'s of the World Agricultural Land Area
Table 2 shows the estimate
for world energy demand in equivalent land areas of high performance PV, using:
-
values for avg
USA PV energy availability from Table 1. above,
-
agricultural land area figures from Nationmaster.com(c),
and
-
IEA economic statistics
for 2008(b), world
GDP of 63 trillion.
With 1$ of world GDP needing 1.39 sq meters
of average sunshine for a day, or .0038 sq meters per yr, to deliver the world average
amount of energy to deliver 1$ of end user products. It's
surely a rough estimate, but the intent is to understand the total scale.
It ignores the wide variation in land suited for solar farms, for example, and
that the constant coupling of growth and efficiency improvement continues.
What doesn't change
is the coupling of land area and available sunshine. While growth might decline
the assumption being tested is that both growth and efficiency continue at the
historic coupled rates, as "growth constants" for the whole system's natural
rates of sustainable learning and reorganization, as before.
That historic energy use "growth constant"
(b)
has been steady for the past 40 years, at 1.89%/yr, and so growing at a
rate with a 37 year doubling period.
World GDP $46.9 trillion in 2000(b)
that would have cast a dollar shadow of 15,490,000 sq km, with world
agricultural land area 48,033,854 sq km as 40% of the total land mass of the
earth,
120,000,000 sq km.
|
Table 2. |
|
World dollar shadow as a % of present
total agricultural land and the world landmass |
|
|
|
|
|
|
|
|
% of Agricultural Land |
|
0.50% |
as % of
Landmass of Earth |
|
.2% |
|
% in 37 yr |
|
1.0% |
% in 37 yr |
|
.4% |
|
% in 74 yr |
|
1.97% |
% in 74 yr |
|
.8% |
|
% in 111 yr |
|
4.06% |
% in 111 yr |
|
1.6% |
|
.....and continuing to double |
|
..... |
....and continuing to double |
|
..... |
|
would you guess it goes to.... |
|
32.5% |
would you guess it goes to.... |
|
12.8% |
|
in another 111 yrs??? |
|
|
in another 111 yr??? |
|
|
Does anyone see a problem with
covering the Earth with PV ??
..or with needing to locate the solar farms near the people ??
..or with the
cost of renting the land for it,
..or
covering the whole earth black
in only a century more??
 ?
?
7. Global Trend Data and Relationships:
IEA World
economic data - Key indicators GDP
Energy & CO2
partial 2008 data for Table 3. and Figure 1., for 2010 IEA source data see reference (b)
|
Table
3. |
1990 |
1995 |
2000 |
2004 |
2005 |
2006 |
2007 |
% change |
notes |
|
Mt CO2
Sectoral method |
20980.5 |
21810.4 |
23497.3 |
26336.1 |
27147 |
28028 |
28962.4 |
38.00% |
|
|
TPES (PJ) |
366834 |
386311 |
419463 |
465685 |
478361 |
490696 |
503664 |
37.30% |
|
|
TPES (QuadBtu) |
347.71 |
366.1716 |
397.5953 |
441.4076 |
453.4227 |
465.1147 |
477.4066 |
37.30% |
x |
|
TPES (QuadkWh) |
0.1019 |
0.1073 |
0.1165 |
0.1293 |
0.1329 |
0.1363 |
0.1399 |
37.30% |
x |
|
GDP
(billion 2000 US$) |
24199.8 |
27133.3 |
31979.8 |
35356.1 |
36585.9 |
38046.5 |
39493.3 |
63.20% |
|
|
GDP PPP
(billion 2000 US$) |
33299.1 |
37759.5 |
45572.7 |
52626 |
55156.7 |
58179.4 |
61428 |
84.50% |
|
|
GDP/GDP-PPP |
0.7267 |
0.7186 |
0.7017 |
0.6718 |
0.6633 |
0.6540 |
0.6429 |
-11.53% |
* |
|
btu TPES/GDP
|
1436.8 |
1349.5 |
1243.3 |
1248.5 |
1239.3 |
1222.5 |
1208.8 |
-15.87% |
** |
|
btu TPES/GDP-PPP |
1044.2 |
969.7 |
872.4 |
838.8 |
822.1 |
799.4 |
777.2^
[8000] |
-25.57% |
**
^ |
|
kWh TPES/GDP
|
0.4210 |
0.3954 |
0.3643 |
0.3658 |
0.3631 |
0.3582 |
0.3542 |
-15.87% |
** |
|
kWh TPES/GDP-PPP |
0.3059 |
0.2841 |
0.2556 |
0.2458 |
0.2409 |
0.2342 |
0.2277^
[2.4] |
-25.57% |
**
^ |
|
Population (millions) |
5259.2 |
5675.7 |
6072.7 |
6382.3 |
6458.9 |
6535.2 |
6609.3 |
25.70% |
|
|
kg
CO2 / GDP
2000 US$ |
0.87 |
0.8 |
0.73 |
0.74 |
0.74 |
0.74 |
0.73 |
-15.40% |
|
|
kg CO2 /
GDP PPP 2000 US$) |
0.63 |
0.58 |
0.52 |
0.5 |
0.49 |
0.48 |
0.47^
[~1lb] |
-25.20% |
^ |
|
Ton CO2
per capita) |
3.99 |
3.84 |
3.87 |
4.13 |
4.2 |
4.29 |
4.38 |
9.80% |
|
|
Mton
CO2/QBtu |
60.3 |
59.6 |
59.1 |
59.7 |
59.9 |
60.3 |
60.7 |
0.5% |
*** |
|
|
^ 2007 IEA data, rounded for use in generic
footprint calculations in brackets [##], for 2014 est ~ 3.6% lower, for
regular historic rate of the economy's improving energy efficiency.
x - original data converted to Btu & kWh units
* energy/$ values
(economic intensity) declining over time at 1.3%, ~25% in 30 years
** ratios of GDP adjusted and unadjusted for "purchasing power parity" PPP to
remove monetary exchange rate discrepancies, for the US unadjusted GDP$
is only ~5% higher
than its PPP adjusted value.
*** For climate change the key observation is that steadily improving
producer efficiency completely overcomes consumer efficiency, to
continually multiply energy use, it also does NOT change the share of
fossil fuel used to produce energy at all, as reflected in the near
constant CO2/Btu ratio...
Info on CO2 from
Wikipedia |
8. Historical
Coupling Constants for Growth -
We see here the surprisingly regular progressively changing rates of world
economic growth (+3.1%/yr), the energy use required (+1.9%/yr), CO2 produced
(+1.9%/yr), and our rate of improving energy efficiency, at (+1.2%/yr).
It's very odd, that these curves clearly show the world economy having a highly
regular behavior as a whole, and so also indicate the world economic system
having a stable "design", in how the parts are organized and working together.
It's both odd that the world economy has such remarkably consistent behavior,
and also that it is very generally not discussed, particularly in relation to
our world preoccupation with changing the linkage of these very same behaviors
of the world economy, for "sustainability".
That we don't seem to study the design of the system we're trying to change, is
a problem. The regularity of the curves shows a highly regular
behavior. Plans for an opposite behavior would need to take into
account, like the staple designs for "sustainable development", for having
efforts to increase efficiency and producing alternative energy to result in
decreased energy use and CO2 (respectively) the reverse of their historic whole
system behavior of accelerating increase with improving efficiency.
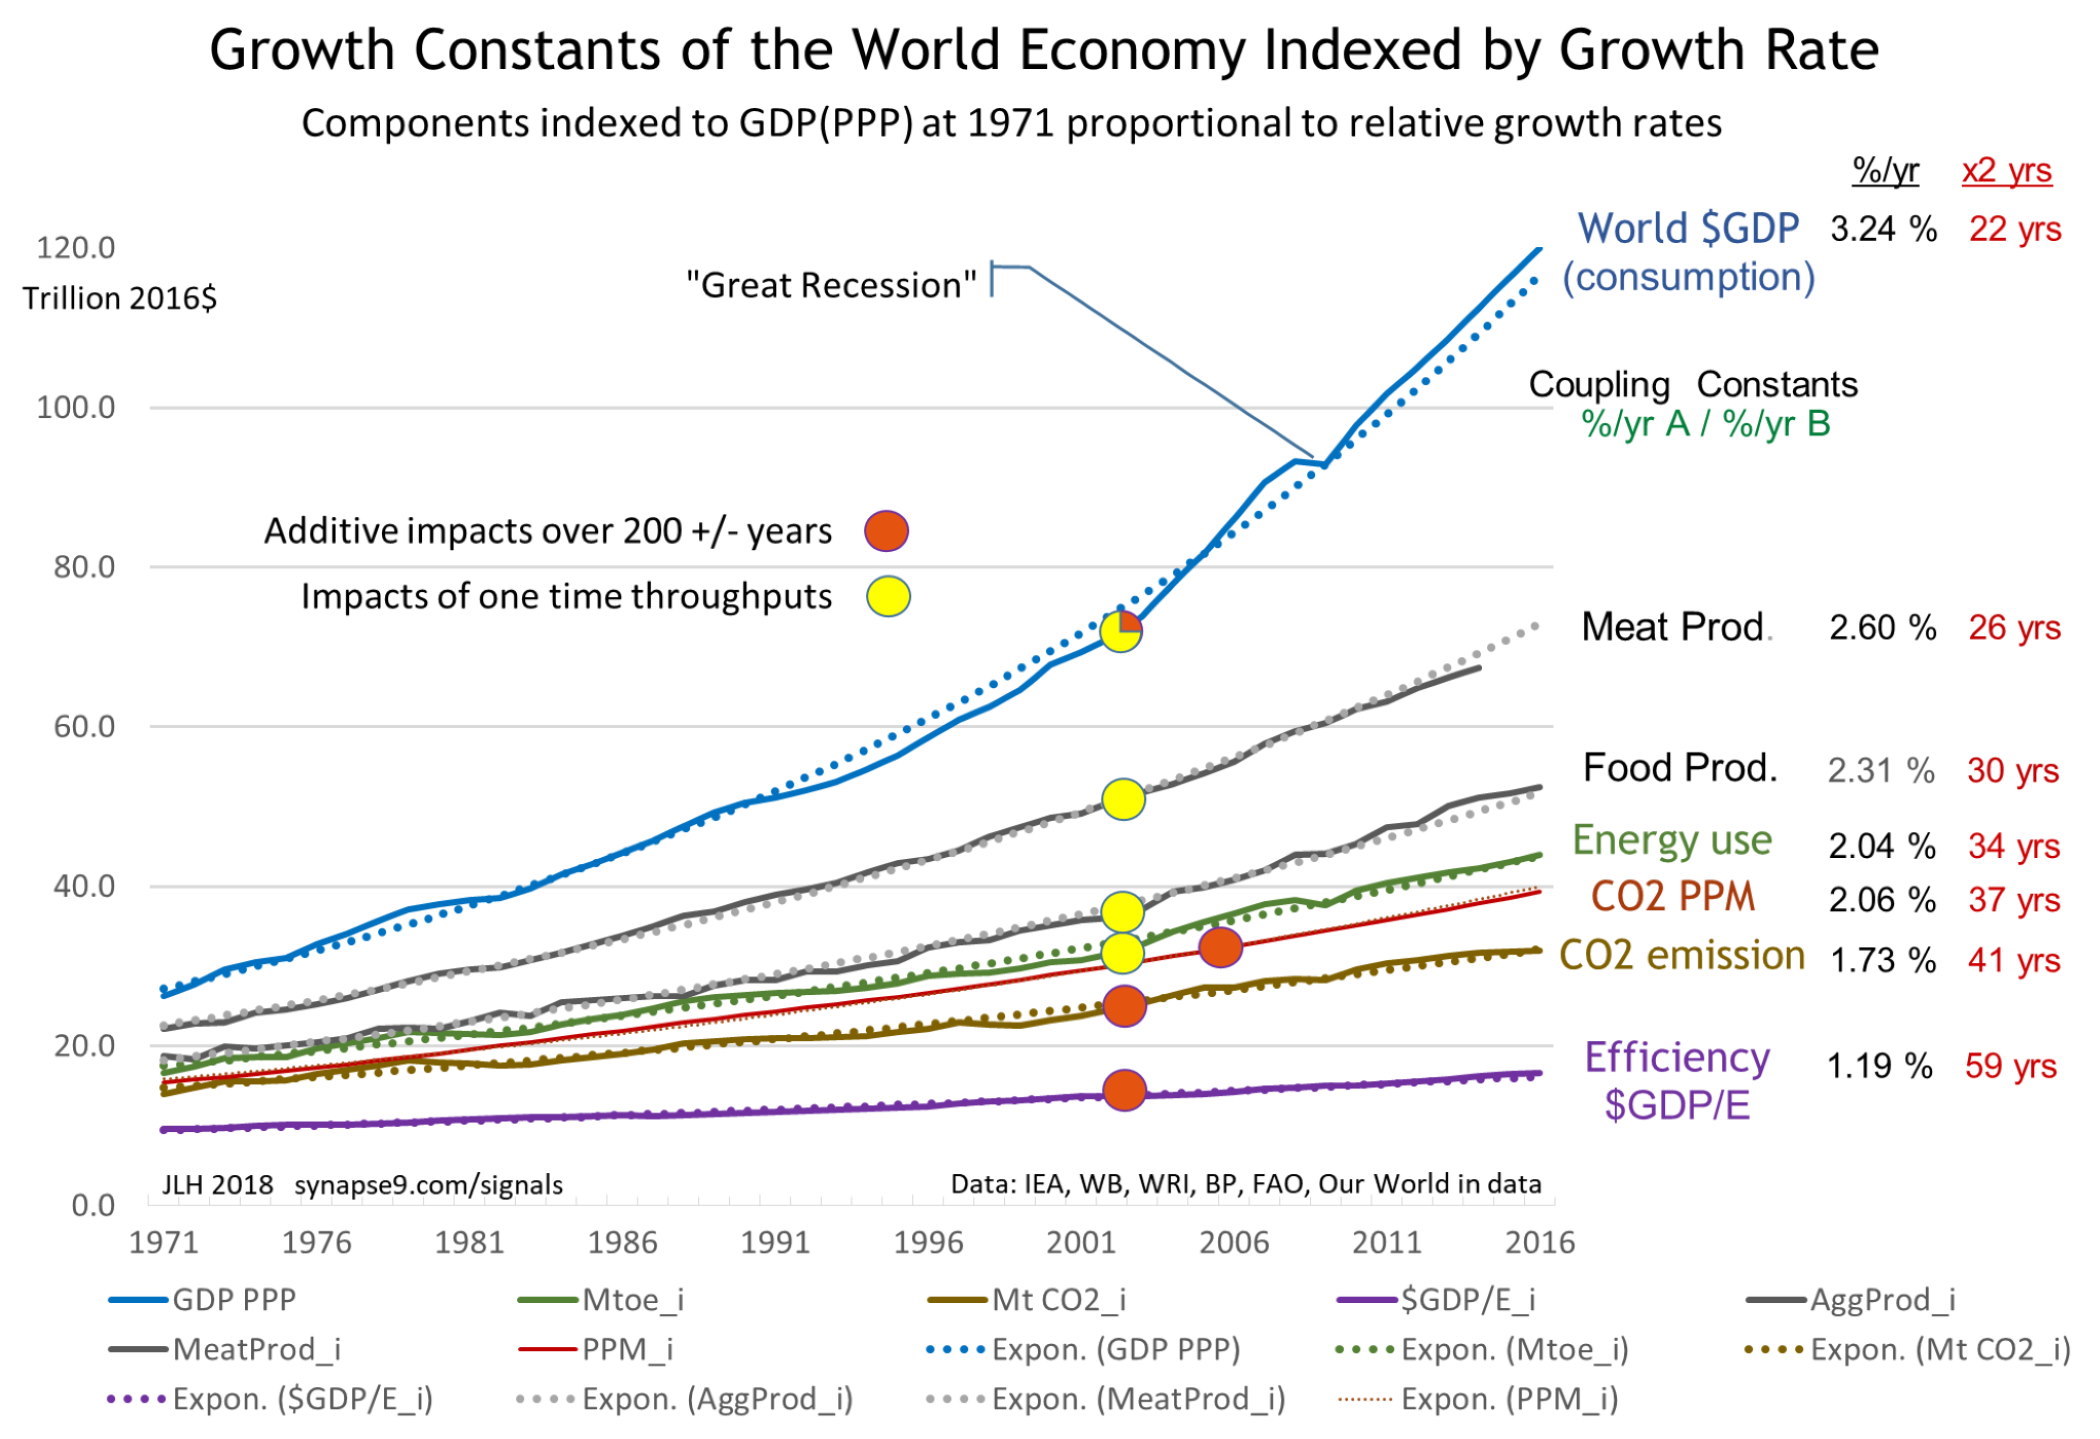
Figure B (f, h)
9. The
scientific basis for measuring impacts with money:
It sounds crazy at first, and so most
people then never ask "What about the averages". That's the
secret, being cautious about your snap judgments, when the whole problem
seems to be "How would anyone know?". Here's the answer to
how anyone can know.
In paying for the economy to deliver
goods and services, nearly all our uses of money are passed on to such a
wide variety of people, who all spend the money they receive on such a wide
variety of different kinds of consumption, the sum total of the hidden
energy uses involved ends up being similar to paying for anything else, i.e.
"about average'. It's not that further studies aren't needed, of
course. It's that based on that distribution, and your initial lack of
better information:
-
"average" is probably a reasonable
estimate for scale, and certainly far more truthful and accurate
than 'zero', and
-
for those studies to find where it
varies, "average" is the only scientifically legitimate
place to start, necessary to "close the accounts" by having the totals
of impacts equal the total of responsibilities assigned for them.
The more technical ways to reach the same
conclusion involve modeling how money travels in the economy.
My way of doing it starts with setting proper bounds. It's clear that
you want to only count energy uses once, and for the total to equal the
economy's total. That is not assured using the method mentioned
in the original paper "Systems Energy
Assessment" of tracing a typical pattern of money being passed to
multiple contributors to the service provided. Like the
reasoning in #1 above, finding that in three month's time parts of any
dollar used would end up in the accounts of every person on earth,
demonstrates a wide distribution, and "startling likelihood", but there is
no "end point" for that distribution.
A good way to define an end point is a
new way of using the same device that economists use for measuring the total
product of the economy, GDP, as the sum of the "end user" purchases in a
given year. That defines an end point if the chains of
production of the economy. The other "end" of the economy is the
accumulation of services paid for to deliver the end products.
So you have a 1-1 mapping of the economy, from "end users" (as the people
consuming the products) to the "end producers" (as the people paid for their
services in producing it, who use what they are paid for their own end
consumption)
So the economy can be mapped as an
accountable exchange between end users and end producers.
Money that is paid for any end use is granted "free and clear" of
obligations (except those paid for) to the service provider, and then at
first largely "passed along", from one business to the next to the next,
with some at each stage being paid to people also "free and clear" as "end
producers", for them to use for their end uses. So the money
being paid for all the multiple branching services in the product and
service chain that are needed to deliver any product, has no destination
other than some person, mostly hidden from view way down the chain
somewhere, being reimbursed for contributing their end services, free and
clear.
|
 |
 |
|
The visible services used in
delivering a purchase to the end user |
|
The chains
leading to mostly hidden services from the end producers needed
|
|
|
Figure C. |
(table 4 shows that most of the
end producer services needed are in the "fat tail" of the chain) |
What a mathematical model seems to show
is that the hidden part of the distribution is much larger than the visible
part. The distribution has what is called a 'fat tail' in the sense
that most of the end producer consumption is far down the line, and so also
more likely to be "average". Statistics won't help much, but
network science could somewhat, if only to help further clarify how reliable
the scale estimate of "average" is, and why it will be economically
infeasible to use any other estimate except for large impacts for which
information is readily available.
If you assume that economic supply and
service chains have a "normal" branching pattern, you can examine the shape
of the distribution. You might guess that spending on end
products normally goes to a mix of smaller and larger businesses.
To study that you start with a simpler model, and see if it's possible to
model more realistic assumptions. What is fairly easy to explore is a
rule that the largest part of the economy is made of
businesses with 40 employees and 50 business service providers paying about
20% of their revenue in salaries. That might vary widely in
reality, of course. The Wind Farm we modeled for
SEA (see p 17)
seemed it would have only about 2% of its revenue in salaries, while
employing lots of business services from companies with a more normal ratio.
So taking the simpler case, you get a
polynomial expansion, with each step
-
removing 20% from the money chain,
-
multiplying the number of employees by a
factor of 40 and
-
multiplying the number of businesses by a
factor of 50.
We'll try to trace where the money goes for a
single $100 purchase from a business, in turn paying 40 employees of all kinds
and purchasing producer services from 50 businesses, which each also have 40
employees and buy services from 50 businesses.
After just 4 steps, one purchase is shown having paid for
the services of a highly diverse group of over five million people
running and operating over 120 thousand businesses, with only 50% of
the end production services paid for.
|
Numbers of people & businesses paid for services
along a business production chain |
|
Table
4. |
Starting from the consumer purchase - steps along the chain |
| |
1 |
2 |
3 |
4 |
5 |
|
$ to
businesses |
$100 |
$80 |
$64 |
$51 |
$41 |
|
$ to
people |
0 |
$20 |
$16 |
$13 |
$10 |
|
(share remaining) |
100% |
80% |
64% |
51% |
41% |
| |
|
|
|
|
|
|
# of
people pd |
0 |
40 |
2,000 |
5,000,000 |
625,000,000,000 |
|
Tot
people pd |
0 |
40 |
2,040 |
5,002,040 |
625,005,002,040 |
| |
|
|
|
(millions) |
(billions) |
|
# of
businesses pd |
0 |
50 |
2,500 |
125,000 |
6,250,000 |
|
Tot
businesses pd |
0 |
50 |
2,550 |
127,550 |
6,377,550 |
| |
|
|
|
(thousands) |
(millions) |
Network analysis could be done on the
data for international trade, such as is compiled and used for EF,
Ecological Footprinting, for example. That or similar studies might
shed some light on what kinds of spending or what kinds of producers deliver
lower than average impact products and services. They won't
erase the problem that most "end producers" will remain hidden from view,
lost in the fat tail of the distribution, just because the information
gathering task is too difficult. As competing designs for
lowering the economy's impacts are studied and tested, more
exceptions may appear, but using this kind of complete accounting approach
won't cause all the prior hidden impacts to re-disappear or things like
that.
jlh 2/20/14
References:
a - National Renewable Energy
Laboratory,
http://www.nrel.gov/gis/solar.html Historical average solar radiation at the ground:
(picking a
"typical" average mid latitude location)
http://www.nrel.gov/gis/images/map_pv_national_lo-res.jpg
b -
IEA World Highlights:
www.iea.org/co2highlights/co2highlights.pdf & 2010 historical data:
http://www.synapse9.com/design/IEA-worldindicators.xlsx
c - Agricultural land use figures:
www.nationmaster.com
d - Method for measuring whole system energy use and EROI:
System Energy
Assessment (SEA)
e - ThoughtForm pop. map
http://www.visualizingeconomics.com/2008/09/07/us-population-density-1990-and-2000/
f - see System Energy
Assessment (SEA) for Whole Business Systems, Henshaw et all, 2011
extending a
2009 talk
h - Understanding why the economy behaves as a whole
The curious use
of Stimulus for Constraint, Henshaw 2011
i - an archive
copy of this page from 2009 with possibly useful early thinking on the issue
jlh Explorations