The scientific
idea: The
'embodied energy'
(or 'energy
intensity') of any product or service is the sum total of all the
energy uses needed to provide it. The problem of adding that all up
is that in an economy most of them are unaccountable. Driving a
car both burns energy in the engine as well as in making and maintaining the
car. Keeping insurance for it, supporting the gas station as a
business and the consumption of the people at the
refinery are also all in there. Your choices are responsible for energy consumption
of very many kinds throughout the entire network of people that take part in
bringing you what you purchase. The money you give them supports
both the energy consuming work they do at their jobs and also the energy
consumption of their entire lifestyles. It's not possible to
count up since you can't ask them what they do with your money and they
wouldn't be able to give you useful answers anyway.
It's actually prohibitively difficult to trace, and so while while not at
all invisible, it also remains completely 'unaccountable'.


The
real problem is that the unaccountable part is so much larger.
The distribution has what is called a 'fat tail' in the sense that most of
the embodied energy for products is located in the tiny contributions
scattered beyond your ability to identify them. These sources remain
'hidden' because the information gathering task is too difficult.
Using the average value for all spending to estimate the energy diffusely
consumed throughout the system
is a
great
shortcut, particularly for getting you to look at the difference between
what you can and can't account for. More work will find more
exceptions, but it seems quite likely to be very accurate for most spending,
simply because of how widely people distribute money, from one source to
many many destinations.
Understanding
that a $1 apple purchased in New York, has a hidden energy cost equal to a
$1 share of the energy used by the whole economy that New York is part of,
takes some thinking. You need to add up all the little bits of
energy use in the world that are required to bring that apple to you where
you are in New York. That includes supporting the farm and all the
activities of the farmer and his family, all the goods and services
resourced from all over the world to support the work of farming and the
consumption that the farmer's whole family relies on the money for. As you count it up it becomes clear that it's the whole
economy that is delivering that apple as a $1 product. There's
also the important insight that most kinds of products are essential
companion products of others. Part of buying an apple is the service
of the whole city's systems in bringing it to you, made possible by your
having clothes and a place to work, the whole environment of interacting
parts that make the exchange possible. It's good general reason
to accept that any part of the whole economic system should be credited with
it's share of the whole system's impacts.
Still
you might say, it just doesn't look like money and energy are the same thing, so
how can they be equal? There are two things that have been
hiding their direct connection from us. It's not coincidental that
energy is nature's universal resource for making things physically
happen and money is our universal resource for making things.
We only pay people, and consider nature's resources as free, but what we are
actually getting when we buy things is packaged energy. Yes, we
only see the 'package' in a sense, but the whole process of making things
consumes energy and so that becomes 'embodied' in the product. The most specific reason
seems to be that when we choose to give money to people we select those who
deliver products for the least energy. That ties maximizing efficiency
and a necessary amount of market determined energy content in every step of product delivery.
Globally that makes price a direct measure of
energy use for every process. That all the economies give energy about
the same economic value and price and are improving their efficiency at the
about the same rate everywhere, then, fairly assures that the relationships
between money and energy
will be uniform in the world and steady.
Because
energy is such a universal commodity, and flows to wherever it is most
needed, it turns out that money has almost the same energy intensity everywhere. The measures show that the economies employ fuels at about the same btu/$
efficiency rate in
every economy, rich and poor, and that the trends of change in all economies
follow the same norms.
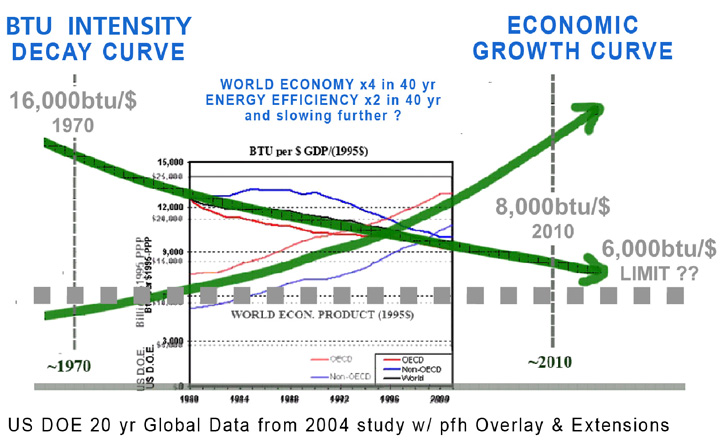
This amazing evidence was gathered by the US Dept. of Energy in a 2004
study (1) and are further verified by the updated 2007 EU IEA data
(6.1) That all the economies behave as a whole in how they
use fuel is another way to say why individual shares of GDP are a good direct measure of
individual shares of global
energy use. Why the economies have consistent matching
global behavior, treating energy as a universally interchangeable part with
a universal matching $ value is harder to explain. It takes an
exploration of complex natural systems, from multiple points of view.
Perhaps the best shortcut way to explain is just that all of nature treats energy that way too. Energy is the
universal interchangeable resource of all systems.
Another
way to understand it has to do
with the 'liquidity' of energy and money and the economic principle of the
'flat earth'(5)(6). Every money event and every energy event have
ripple effects that spread throughout the economic system.
Some settle out quickly and some more slowly, but they all tend to seek a
single common level, like ripples in a pool. You can see this in the
energy intensity curves for individual economies (1). Even though the
individual economies are all are heading in the same direction they each do
so in a different way. You can also see it in the way
economies sell whole market baskets of products, not individual ones.
No one product is either useful or producible without an extended network of
'companion products'. For the energy intensity of spending to vary
from place to place would require change in the whole network of companion
products to constitute a local 'product space' (16). Logic
suggests
that choosing to buy products from product communities (product spaces) with unusually low energy
intensity, for example, would only be possible from within them.
They probably exist and your lifestyle or community might develop a system
learning path toward becoming part of them, but doing that is not a readily available choice for most people.
The economies are very thoroughly integrated on price alone. You can think
your economic world is local, but so much of the true network of dollar
flows is probably global.
It
would certainly be nice to be know about low-impact product communities, how
they might
develop and what it takes to encourage them. That's an area of
research that's wide open it seems. The obvious one is the
loose idea of choosing to live and work in a 'green world', with everyone in
the 'network living simply. It's
physically possible for that to work and for such networks to become stable evolving and
self-sufficient. There are also lots of hidden flaws in
the idea that help explain why the way
people normally think of doing it usually fails. Product networks that separate
you from
the larger economy tend to wither is the main one. There's
also a lot of the 'you can't get there from here' problem. Product spaces have
natural whole system learning paths that enable or restrict their
development and it would be good if more study was put into understand them
better. It seems very likely that reducing the energy intensity
of spending while retaining high quality services requires whole
system change.
That
whole system change in energy efficiency is realistic and happening
naturally anyway is evident in the DOE data curve above, showing a typical
decay trend, and in the 35 year IEA world energy intensity data (6.1)
which shows more detail. A close look at the detailed world
energy intensity curve shows a 'stairstep' shape to the curve, which seems
likely to indicate alternating periods of 'retooling' and 'using' emerging
kinds of systemic efficiencies. Studying the subject would
probably lead to a better understanding of whole system efficiencies
develop.
How you
might use it:
The first principle of systems learning is to just start with small
accumulative steps. Make sure you 'look around',
find a few things to put 'in the box', including ideas for looking further, and add up the
total. Basing your choices on 100% rather than less than 10%
of your direct energy impacts on the earth is good. It's not an
answer, it's a better question. Better information about our
whole impacts will make our choices, of all kinds, more effective.
It helps correct the flaw of economies
that the natural systems on which we entirely depend are
universally assigned the value of $0. That's a very curious error,
and not easy to correct.
I
f
you wanted to assign a value to nature, what would it be and who would you
pay, anyway? It just does not fit the model. The economies do not recognize the
value of their environments in much the same way as a formula is completely
self-contained and can't change itself in response to changing behaviors of the world around it.
One thing we can do, now that we see that $=energy quite directly, is
understand that defining 'good' in terms of the rate of multiplying $'s is
inherently bad. It's missing all the relevant connected values.
We need other definitions of good, ones that take nature into account. We
need things like learning to use rigorous whole system measures to give the
word "sustainability" more substantive meaning as an end product.
Using global impact
measures is essentially just another way to guide project design to
produce a better product, like the rigorous credit point checklists used in
LEED, the energy rating estimator used in Green Globes, or my
4Dsustainability learning and evaluation model, or other methods. The difference
with accounting for the whole impacts of things is that you can then measure
whether your adaptations have increased or decreased your impacts on the
earth. The point systems like LEED don't actually give you that
information, though. Consequently most traditional or green projects still
produce large and
increasing environmental impacts. LEED just measures quality,
and doesn't measure quantity except as a qualitative ratio, so there's not
'total'. We've learned how to increase our impacts on the earth
more efficiently... but that's not good enough.
The steps for using the
$Shadow measure on a
building project
begins with comparing the total energy use implied for
average btu/$ spending with the particular energy uses you can
measure. That means multiplying an initial total project costs by
8000btu/$ and comparing it to the fuels and other things the project would
consume. Then you'd try to explain the difference and adjust
your estimate up or down accordingly. It can be done with either
complete analytical rigor or just rounded up or down based on judgment.
You'd want to do this in a way that is simple at first and lets you come
back to refine it. Then you'd do the same thing for a
baseline reference project costs. That might be the prior use of
the site or a prior service being replaced, something to compare in a
meaningful way to give you the change in the earth, before and after doing your
project. Two ways of doing this for a sample project are in
my resources (11, 14)
The
next step is to choose one or two more additional total project impact measures, such as using the
$Shadow method for CO2 as well (fairly easy) or the Energy Star
project energy estimator (fairly easy) and the EF global
environmental footprint
method (a little more work). Then you'd have a picture of before
and after for energy, for CO2 and for renewable eco-systems services. You
might also want to add onto that using the greenhouse gas inventory
method of GHGprotocol.org which is likely to become a reporting requirement
for all businesses and the Athena life-cycle assessment tool for a
complete impact picture (a lot more work).
There's
a real value of keeping
things simple, and
as rigorously complete as you can. That's partly because you want to
be able to adjust them over and over, and if it's too complicated it's not
going to be useful. It may be the most important lesson of all
to recognize, in designing our new way of design we've been doing the
opposite. We've 'innocently' been stepping into a job of micro-managing
whole environmental systems and our increasingly complex interactions with
them. Yes, that is partly
forced on us by everyone being caught off guard by our massive interference in the earth's natural systems.
We also err in thinking that taking on ever more complicated problems is
solvable. It's not. It means taking on ever
steeper learning curves. Hm... Learning how nature
does things of exceeding complexity, very simply, is on this learning path,
but a ways along, so the immediate next step is to add a couple more rows to
your project's whole impact measure chart (14,15).
The next
things to look at are your adjustments. With
any estimating method you need to make adjustments to balance what's
accountable and what's not, combining direct measures with contingencies
for what's unmeasurable. Cost estimating always does that, and
impact estimating needs to do that too. For any method you use if the
'contingency' is not there, you need to plug one in. For the
$shadow method the entire estimate is for 'unaccountable' energy costs, and
you need to adjust it for the accountable 'non-average' impacts you can see.
The simple, and nearly correct way to do that is simply adjust the project
$shadow by adding all the direct fuel uses as direct impacts.
That means if you can count a certain number of btu equivalents for
electricity uses, just add it to the total, since the $Shadow measure large
estimates the consumption of the people behind the product. Other
materials might have more or less than the average. Concrete,
for example uses direct energy six times the btu/$ of average spending, or
around 48,000btu/$. These kinds of rules of thumb are needed for
a wide variety of materials and systems. The only one I can think of
that might significantly reduce the embodied energy of spending would is
when the main value of the product is as art, and most of the 'value added'
is in the artist's signature.
The next step
really shows you why this needs to be kept fairly simple. It's
to compare your target scenario
and compensations. The
target scenario could be to raise project quality in a way that makes
reducing project impacts to somewhere around 1950 levels for the same
functions. That's very roughly the global warming objective.
One could pick a target in lots of other ways too, as Architecture2030 does,
for example. Then you compare that with your proposed
project totals and that tells you how much
you need to compensate for somehow. Designing your
compensations is the true creative challenge. Make real,
honest estimates of the beneficial impacts for project choices that would
have direct community or environmental benefits or long range effects on the future. A publisher, for example, might devote a
portion of their staff hours to maintaining a community resource website for
any target community they think might benefit from having help
communicating, local or international. The diversity of ways to effect the future is
immense, of course. The big one, and the toughest and most
important, is helping people figure how we can stop having growing impacts
on the earth as a whole world. That's not just a lifestyle
change, but true whole community learning, and the first small
accumulating material steps are of extraordinary real value.
Any
particular project would
have different results, but for one five story project the $Shadow estimate was
that it would take high performance PV panels 125 times the size of the
building footprint to supply the energy for its combined operating and
amortized development costs. That's a multiple of 22 times the
estimated footprint of the reference prior site use, small scale
brownstones. One compensation goal considered was to materially
contribute, to the degree the project missed the target, to reversing energy use growth in the building's
stakeholder community toward achieving the IPCC 80% CO2 reduction target. Asking how to do
that
stimulated two main ideas, and a new path of learning sustainability in
the stakeholder community. One was that we could reduce the
building size by finding a collaborator in the neighborhood to share some
functions, and share the expensive centerpiece of the design in this case, so
that expensive piece could have multiple uses. That would greatly reduce both the
footprint and the compensation target. Then we also began
looking in an open ended way at who the stakeholders in the project really
were, and how their interests could be combined to create other value
for free.
One idea was to pitch in on the city sustainability plan, initially
considering storm water retention to help prevent polluting runoff and
restore the ecology, but also deciding to go well beyond the intent in use the LEED education point. That would serve as one of the project's
'bright green spots' and a good research and experimentation opportunity.
Another idea was to influence the future by the project becoming a
neighborhood center for helping people with their energy and CO2
inventories. We also considered compensations in relation to 1)
their lasting accumulative direct effect, 2) their value as important
symbols, and 3)
carefully examining them and avoiding
those possibly having reverse effects. Of course the
plan included to make efficient buildings and measure progress with other measures
like LEED.
The fact what can have the most effect is whole system learning, and
accountable impacts like efficiency measures address may control only 10% of
the problem, does change the picture. In many cases it's hard to imagine how a building could effect the future,
particularly enough to reverse it's own excess impacts.
Learning curves always start slow, though, with small steps. What's
important is the accumulation of steps and the quality of the learning.
It's what a finite, fragile, and truly beautiful blue ball in space seems to
need from us.
1-Whether you call the $1 energy constant 8000 btu or 1,000 sf-hours (1995 constant $), it reflects the ability of energy
to satisfy the values that people actually
have. Discounting efficiency gains as small compared to growth, energy for increased $'s
will come from fossil fuels, nuclear, geo-thermal or the sun. The principle
flexibility in getting energy from the sun is competing land uses. For
every 8000btu of fossil fuel you want to offset with renewables you need to
set aside an additional .1sf of high return land for energy production. At
first it seems easy, and then it gets hard, because converting land to
energy production comes out of land already in use for something. This draws very clearly
the limits of the earth, and brings into question our curious worldwide
devotion to multiplying money, as if it could come out of a magic hole in the
ground. Apparently we think that because much of it actually did! ;-)
Why people thought doubling the size of economies about every 20 years
forever would be a reasonable plan for the future, requiring
ever expanding resources or products and services using vanishingly small
amounts of them, is a mystery. The idea that our 200 year
experience of magic energy from the ground in a pristine world would
automatically be repeated over and over, well, looks like wishful thinking
with support coming largely from our lack of evidence.
1/20/08
2-
deleted
3- We've
been waiting for 'the big crunch' when the growth economy hits the limits of
the earth. Clearly, prices and technologies have been responding
to the future of energy and environment problems for many years, but also in
several ways accelerating toward while ignoring the approach of the very
firm limits of the earth and it's ecological capacities entirely. I could be off, but think we're likely to look back
and see
that June 2007 marked the beginning of the real collision between our
unconditional growth system and the
finite earth. It was that interesting little milk/corn price jump
we had. The bump in prices came directly from the technology 'surge' to replace fossil fuels with
methanol, and the 'unexpected' discovery that there was no free land to
supply it. In the complex system of feedbacks that kind
of discovery sets off ripples of the economy's natural steering system. I think
it's likely to be the first of a serious of multiplying rather than damping
swerves in response. Exactly how is hard to judge, but the reactions
of a growth economy to rigid energy growth limits is quite inevitably going
to intensify because
of the $/btu constant, fixed land mass and major interests in limiting our
impacts on the earth. Whether I picked the start
of it correctly or not, we probably don't need to worry about
whether this whole event will be noticed!
1/20/08
4-
Doesn't there have to be some hidden 'give' in
the picture. We don't know the limits of lots of things, but no
one is going to change the size of the earth or principles like the conservation of energy(20)
or the principle of diminishing returns(23, 24). Both are highly
trusted principles of physics that we are still discovering the real meaning
of.
What people have always valued and desired is not likely to change
abruptly either. We're just not going to buy products that have
vanishing amounts of resource content. We're also not going to change
the properties of the systems we rely on, nor turn technologies that are
running out of improvements to make into ones with limitless horizons again.
These are all 'discovered' facts not 'made up' ones. The main
one that prevents continuation of the kind of growth economies have relied
on is the diminishing returns of investing in the earth, evident in our
finding resources in smaller and harder to get at amounts. It is also
clearly evident in the stable and steadily slowing improvement in the whole
system energy efficiency curves. Energy efficiency improvements
are now coming at less than half the rate expanding energy uses(17).
After the big reserves of easy to use resources are used what's left are the
smaller reserves of ones that are harder to use, and it takes more
investment. That's diminishing returns, when it takes more physical
investment to get the same physical return.
When miles of landscape
are turned into housing sprawl, it does
not appear on the news and we don't see the global sweep of eliminating the
opportunities that were there before, but the opportunity the empty space once
represented is gone. After a
sweeping conversion of land to buildings and
highways you can't just rearrange it for higher density and grow corn again!
We don't see that, but instead hear stories like the announcement of a
possible 40% efficiency solar cell, seeming to suggest solar power efficiency
could multiply by a factor of 10 soon and create a whole new source of energy.
The curves of how the whole system is producing energy efficiencies show only
a long term potential for 1.2% a year improvement, not jump by factors of 10. At
1.2% a year a factor of 10 improvement would take almost 200 years.
That apparent contradiction is confusing.
What
the long range curves show is the collective behavior of the whole system,
including all the millions of brilliant inventors doing their very best to
improve the performance of everything that is sold by every means possible.
That's a primary way for business to remain competitive.
Individual anecdotes simply are not 'vetted' for the truth of their
appearances that way, shaken down from many many perspectives at once, and
tested for how they'll integrate with everything else. The global
trends showing whole system maturation are simply direct indications of it.
They're not theories, and they're not projections. They're
measures.
1/20/08